


THE WORLD IS YOURS!
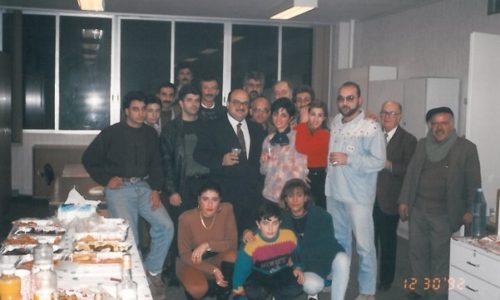
For more than 95 years, we have helped businesses and individuals move their merchandise to and from the Middle-East across the globe, time and time again. We continue to offer an ever increasing palette of services, in the fast and efficient way we’ve been accustomed to.
The most elementary role of the international freight forwarder is to arrange for the movement of goods from point A to point B in the most economical, timely and safe fashion. Nevertheless, nowadays movements are more complex, that’s why you need a reliable partner.
The expertise Cargomaster can provide is that of being familiar with the carriers, port operations, port facilities, cargo handling, documentation, licenses needed and of being able to advise which carrier, port and equipment is appropriate for a particular cargo along with the necessary costing.
It is knowledge of the facilities and those who handle the product, rather than knowledge of the product itself which is important when cargo is concerned.
The way we move your cargo today has a direct impact on where your business will land tomorrow!


Cargomaster is a team of dedicated people, working round the clock to provide you, efficiently, the quality service and the expertise that fail to many. Shipping goods is our business and we are extremely proud of what we do.
Our online facilities provide an unprecedented tool that helps our Clients in their everyday business, and shall fill the need for information to our future Clients.
ELIE ABOUZEID
Founder
Our Services
Globally known for our ability to handle every detail of our customers’ needs, Cargomaster takes care of all your logistics.

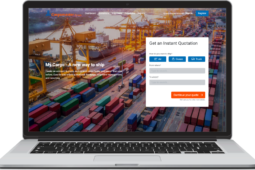
My.Cargo
My.Cargo is the 1st logistics digital platform in Lebanon offering 24/7 visibility.
read more→
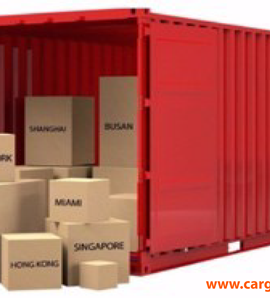
Groupage
Need to ship 3 sofas that fill-up your living room but not a container? It’s easy as 1,2,3!
read more→Customs Clearance
Preparation & submission of documentations required to facilitate export or imports.
read more→
Warehousing & Logistics
We’ll keep your most voluminous cargo in our fully-equiped warehouses.
read more→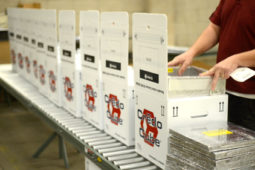

Event Logistics
Event logistics for fairs & exhibitions means total door-to-door turnkey solutions.
read more→
Household Removal
We pick up, store and ship your belongings in a secure and safe process.
read more→

Added Value Services
We regularly have to take care of many smaller tasks and offer other basic services.
read more→Quality and Performance to all Clientele
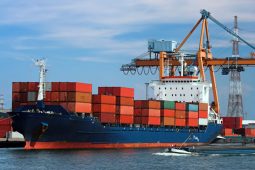
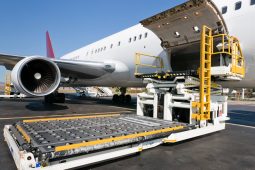
Cargomaster is a leading provider of end-to-end supply chain solutions. We combine intercontinental Air and Ocean Freight with comprehensive Value-Added Services. The range of Supply Chain Solutions can vary from simple transport or storage up to complex operations.
We optimize all activities around information, material and financial flow. We provide globally integrated end-to-end solutions tailored to our customers’ supply chain management needs with a special commitment to industry specific requirements.
COMMERCIAL SECTOR
Get your merchandise efficiently & on schedule not to miss any opportunity.
INDUSTRIAL SECTOR
Get your raw materials for production & deliver your products all around the world.
HOUSEHOLD REMOVAL
Move your family’s belongings quickly and hassle-free.
Latest News
-
 12Aug
12Aug37 Years of Weekly Shipments from Antwerp
30 Years of Uninterrupted Weekly Groupage service from Antwerp, serving more than 10 neighboring countries.
learn more→ -
 27Feb
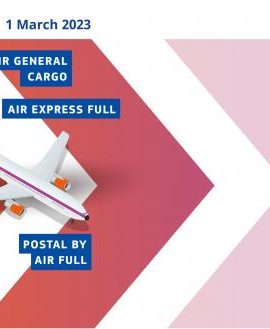
27FebNew ICS2 Requirements for Air Export ✈️ to/via EU
New ICS2 Requirements for Air Export ✈️ to/via EU require new data submission before cargo departure starting 1st of March, 2023
learn more→ -
 14Dec
14DecIberia to Lebanon, DIRECT
The Iberian Peninsula to Lebanon DIRECT. Accepting cargo in 6 locations and sailing to Beirut from Barcelona port.
learn more→ -
 13Jan
13JanCoronavirus Update
The safety of our employees & community is our top priority. We are taking necessary measures to ensure no disruption of normal business operations.
learn more→ -
 17Feb
17FebExport Groupage via Antwerp Since 1985
Exporting your cargo from Lebanon since 1985. Groupage service to +500 destinations worldwide.
learn more→
OUR CORPORATE GUIDELINES
Ensuring transparent & visible communications with customers. Building long-term partnerships – loyalty & credibility.
Commitment to quality – Ensuring punctuality & accuracy of services. Always operate with rich human qualities: passion, strong will & creativity. Go-getter attitude.
Always put customers first & pursue fair profit. Learn to listen & ability to interpret the customers’ needs. Present added value to customers.
Contribute to the advancement of the global economy by engaging in community & global activities. Live up to society’s trust in us by being fair, ethical & responsible.
Have a project? Request a quote. It is easy and fast!
Track shipment to know when your package is on the way!
Useful info about freight transport and shipping in Lebanon and the Middle-East!